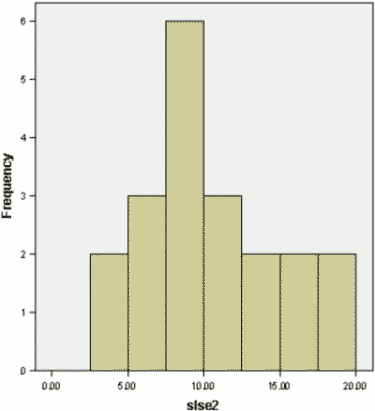
SLSE Form II was designed as the complement to SLSE I, and at least for 20 individuals so far, a preliminary analysis will be performed in order to begin to understand the relationship (if any) between the two forms. As will be seen later in the analysis, there is definitely a positive relationship between the two tests, although they evidently also tap non-overlapping abilities. SLSE II likely also measures fluid g, although possibly in a different manner. With the two tests combined, a better measure would likely be created.

The mean of the above histogram is 10.15 (SD = 4.66). There is a slight positive skew in the distribution, demonstrating that this test is harder than SLSE I. This is logical from the point of view of the test creator, as the initial intention was to make the second form a more difficult test (however, I'm biased). The above histogram is evidence for this. The highest score of 20 correct (out of 30) is impressive indeed.
All the individuals who took SLSE II fortunately also had completed SLSE I, with their average score on SLSE I being 24.3 (SD = 7.95). This mean score is slightly higher than the one for all 169 SLSE I test takers (with a mean of about 23 and SD = 7.51), showing that those who attempted SLSE II were marginally (on average) more able than the SLSE I pool.
| SLSE I | 20 | 0.668** |
**p<.01
The correlation above demonstrates that SLSE I and II are definitely related. Although there is no guarantee of a linear relationship between the tests, it is a best first approximation towards a theoretical IQ score, therefore just as for SLSE I a regression equation was derived based upon the relationship between SLSE Forms I and II. This equation in comparison to the one for SLSE I illustrates again that the second form is more difficult.
| SLSE II Raw | Theoretical IQ |
|---|---|
| 1 | 135 |
| 5 | 141 |
| 10 | 149 |
| 15 | 158 |
| 20 | 166 |
| 25 | 174 |
| 30 | 182+ |
However, a corollary of the above table is that even if you get one item right on SLSE II, chances are you'd qualify for a group like Mensa. The sad thing is, living with that logic, even if you got zero right according to the equation above, you'd also make it in. This demonstrates the limitations of the equation (and linear regression in general at least used in this context). Therefore the equation delineated above should be used mainly to predict scores in the middle of the range of SLSE II, say from 10 to about 20. The extrapolated function is likely either nonlinear in nature, or just impossible at this point to know. My personal feeling is that the distribution would be more accurate if it looked something like the table below (which is roughly based on the score pairs between SLSE II and various other high range and standardized tests). This table is what I consider to be the official preliminary norm for the test. Of course, the numbers are approximate, and should be interpreted with care.
| SLSE II Raw | Theoretical IQ |
|---|---|
| 1 | 110 |
| 5 | 135 |
| 10 | 155 |
| 15 | 164 |
| 20 | 175 |
| 25 | 185 |
| 30 | 200+ |
Item analysis was conducted on the small sample of 20, and although these results are obviously not stabilized due to the small N, they already showed general trends. Again, similar to Form I, SLSE II items were spread throughout the difficulty range, but differently. Five items remain unsolved on Form II. Based upon this analysis, in comparison to SLSE I, the items of SLSE II are more difficult.
Overall, there are few conclusions to be drawn, especially with a sample of only 20. However, it is evident based upon the analyses discussed in this report that SLSE II is complimentary to Form I and if the marriage between the tests were to occur, it would undoubtedly let those who are "intellectually tall" have the opportunity to stand up straight, lengthening not only the test in number of items, but most importantly in gradations of difficulty. At this time, however, the tests are being offered as two separate opportunities to exercise one's logical imagination. At the end of the day, of course, the hope for the future of any scientist is always "more data."