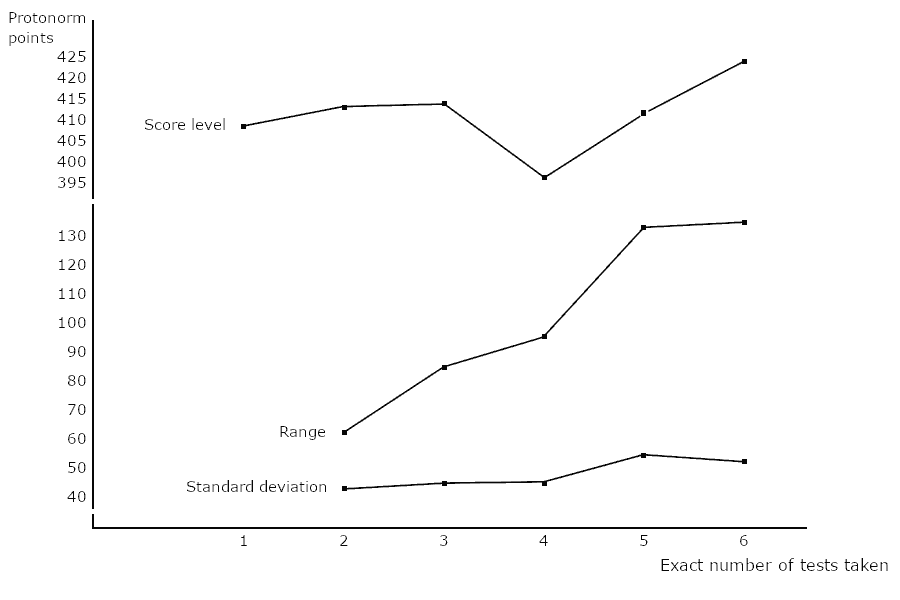
This report contains some intraindividual statistics for mutually exclusive groups of candidates having taken a certain exact number of tests: 1, 2, 3… and so on, until the number of candidates with the next number of tests becomes less than 15. Note well, these groups are mutually exclusive, so this is not the chronological score development within the individual candidates! The procedure is done separately for heterogeneous, homogeneous, and all (heterogeneous plus homogeneous) tests. To give a visual impression of the result for heterogeneous tests, here is a graph:

It can be observed that especially the intraindividual range of scores (= difference between one's highest and lowest score, in protonorm points here) increases sharply over the first several tests. This is logical and exactly what one would expect with any repeated measurement. The intraindividual standard deviation increases too, which is also logical because it is affected by the outliers that, by definition, form the range. The score level (mean of intraindividual median scores) shows an upward trend, as also observed anecdotally and also revealed by other methods of studying intraindividual variation; but do keep in mind that these are mutually exclusive groups of candidates, so this is not necessarily the development within the individual! The fact that the score level graph becomes zig-zag to the right may be caused by the lower numbers of candidates that have taken exactly those numbers of tests, and hence the increased sampling error there. On the other hand, other methods of studying individual score development when taking several tests have also shown a decline after an initial increase.
The complete results for heterogeneous, homogeneous, and heterogeneous plus homogeneous tests are given below to allow for closer inspection. More aspects of intraindividual score variation will be studied in a separate report; the findings in the present report are useful in determining the "minimum number of tests taken" for candidates to be included in that other study.
| # tests taken | 1 | 2 | 3 | 4 | 5 | 6 |
|---|---|---|---|---|---|---|
| # candidates | 481 | 160 | 57 | 29 | 34 | 17 |
| # scores | 481 | 320 | 171 | 116 | 170 | 102 |
| Mean of the candidates' median scores | 408.5 | 412.7 | 414.2 | 395.7 | 410.9 | 423.7 |
| Mean of the candidates' standard deviations | 43.3 | 44.3 | 44.0 | 54.0 | 51.4 | |
| Mean of the candidates' ranges | 61.3 | 84.3 | 95.2 | 131.9 | 133.4 |
| # tests taken | 1 | 2 | 3 | 4 | 5 | 6 |
|---|---|---|---|---|---|---|
| # candidates | 954 | 200 | 101 | 57 | 44 | 28 |
| # scores | 954 | 400 | 303 | 228 | 220 | 168 |
| Mean of the candidates' median scores | 343.3 | 398.9 | 410.4 | 395.7 | 421.7 | 406.9 |
| Mean of the candidates' standard deviations | 48.6 | 48.4 | 60.8 | 51.3 | 49.4 | |
| Mean of the candidates' ranges | 68.7 | 92.2 | 135.5 | 127.5 | 129.0 |
Remark: The low score level for 1 test taken is caused by the very large number of scores by one-time test takers on the early Qoymans Multiple Choice tests in 2002, which were mostly free, perceived as easy, and thus very popular. The average scores on those tests were much lower than those on most high-range tests. In two-time test takers, the depressing effect of early Qoymans Multiple Choice tests is much less noticeable.
| # tests taken | 1 | 2 | 3 | 4 | 5 | 6 | 7 | 8 | 9 | 10 | 11 |
|---|---|---|---|---|---|---|---|---|---|---|---|
| # candidates | 1239 | 165 | 100 | 93 | 58 | 45 | 27 | 30 | 17 | 15 | 17 |
| # scores | 1239 | 330 | 300 | 372 | 290 | 270 | 189 | 240 | 153 | 150 | 187 |
| Mean of the candidates' median scores | 359.3 | 399.0 | 386.8 | 405.5 | 395.5 | 430.5 | 418.0 | 421.4 | 412.1 | 400.9 | 435.5 |
| Mean of the candidates' standard deviations | 45.1 | 46.1 | 47.9 | 48.0 | 57.3 | 45.1 | 47.8 | 59.3 | 53.2 | 55.4 | |
| Mean of the candidates' ranges | 63.7 | 87.7 | 107.6 | 118.2 | 152.8 | 128.6 | 139.9 | 176.8 | 168.3 | 178.1 |
Remark: Again, the low score level for 1 test taken is caused by the very large number of scores by one-time test takers on the early Qoymans Multiple Choice tests in 2002.